We first met internally as a programme team to develop a strategic plan, then consulted the client, asking for more details and contractor transactional data. We thoroughly analysed the client’s standard salaries, bonus systems and costing breakdowns, visualising outputs through Power Query for a better view and data comparison.
This allowed us to identify any anomalies or inconsistencies and flag them before they could cause any more harm. The Pontoon team thoroughly investigated 103,000 transactions (180 lines of data over two years), running additional checks and balances on the top 10-20 engagement managers with the largest contractor spend. To narrow the search, we focused on managers who offered their workers the highest percentage of additional bonuses and miscellaneous fees in relation to their basic salary. We also looked at several spending categories, including “overtime” and “other expenses”.
As an example, see Chart 1. Based on the top 10 selected managers, their unidentified/not described costs (“others”) increased 27% between 2021 and 2022.
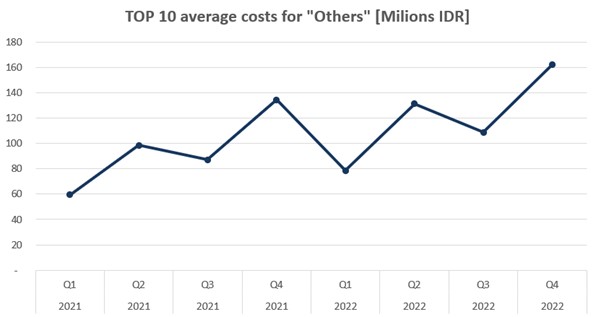
Chart 1. Not regular salary costs tagged as “Others” based on TOP 10 Managers
Compared to all contractors in the APAC region, we also noticed a significant upward trend in “overtime costs”. Chart 2 shows the 92% increase witnessed between 2021 and 2022.
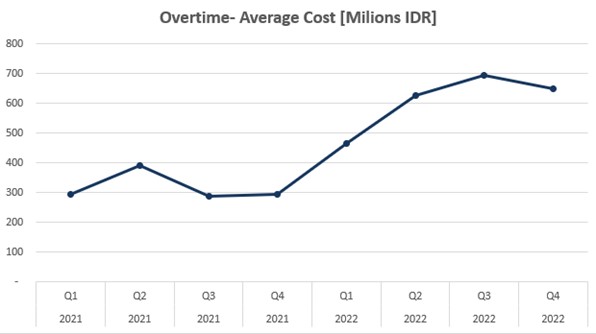
Chart 2. Average overtime costs for all contractors located in APAC Region
Our results indicated that some client managers were offering more than the standard salary, with 2% generating over 20% of the total additional fees and programme expenses. This allowed us to alert our client in real time, enabling them to take immediate action and prevent financial losses.